
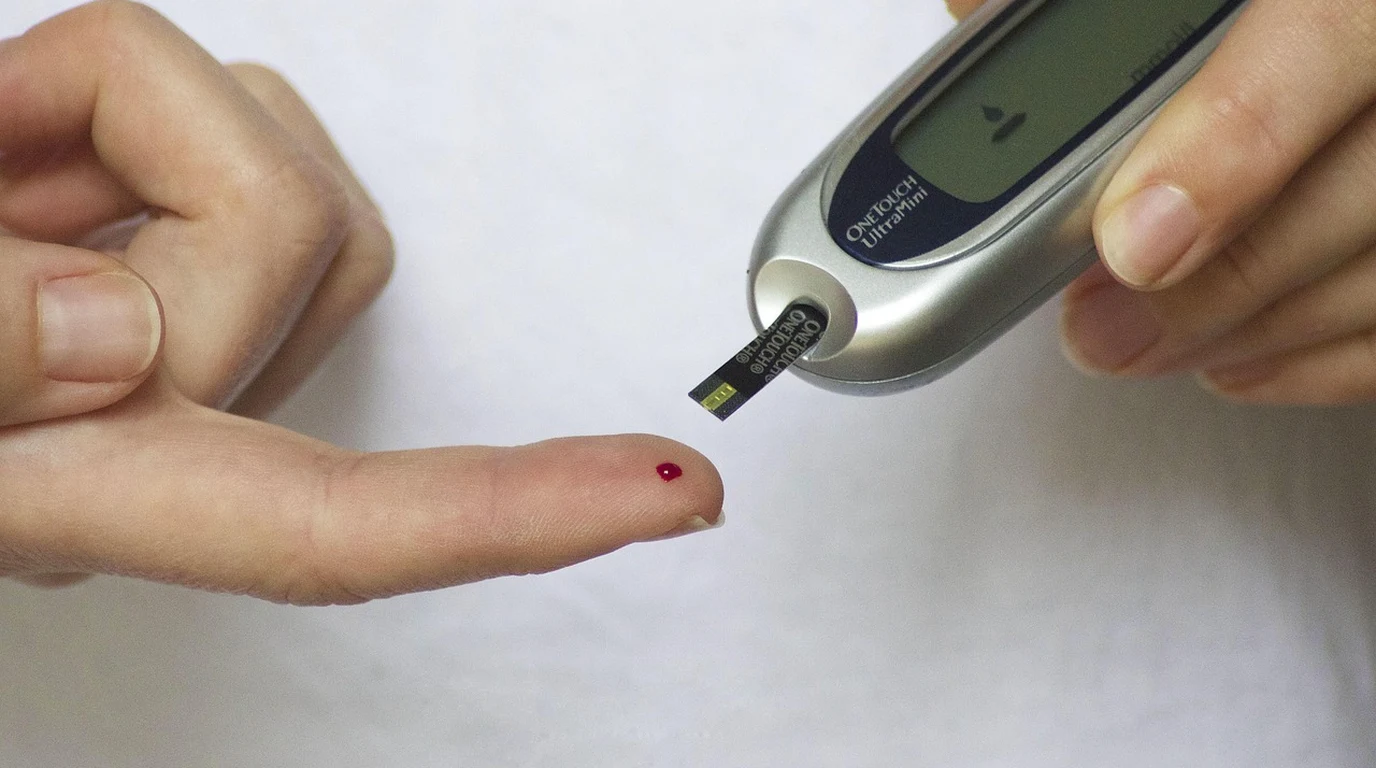
In standard preventative medical examinations, routine blood testing for metabolic health focuses almost entirely on two conventional metrics: Fasting Blood Glucose and Hemoglobin A1c (HbA1c). If a patient’s fasting glucose falls below 100 mg/dL (5.6 mmol/L) and HbA1c remains under 5.7%, primary care physicians routinely assure the individual that their blood sugar regulation is flawless. However, modern metabolic research has revealed that waiting for fasting glucose or HbA1c to climb into prediabetic territory is an act of clinical negligence. The human pancreas is an extraordinary metabolic compensator: in the face of progressive cellular insulin resistance, beta cells dramatically increase insulin production, pumping out massive compensatory waves of hormone to keep circulating blood glucose within normal laboratory ranges. This state of hidden Hyperinsulinemia can persist for 10 to 15 years before blood glucose finally spikes. Here is Ryan Cole’s forensic clinical teardown of Fasting Insulin versus HbA1c, HOMA-IR mathematical scoring, visceral adipose dysfunction, and the insulin resistance triad.
Why Does Fasting Insulin Detect Insulin Resistance 10 Years Before HbA1c?
The biological cascade of type 2 diabetes is not a sudden failure of glucose regulation; it is the final end-stage exhaustion of pancreatic beta cells. In an insulin-sensitive individual, a tiny whisper of insulin (2 to 4 uIU/mL) easily signals GLUT4 glucose transporters in skeletal muscle to clear dietary carbohydrates. When muscle and liver tissues become stuffed with ectopic lipid accumulation (diacylglycerol and ceramides), insulin receptors become desensitized. The pancreas compensates by shouting: it secretes 10x more insulin (15 to 30 uIU/mL) to force the same quantity of glucose across cell membranes.
The HOMA-IR Mathematical Formula: Quantifying Insulin Sensitivity
To accurately evaluate metabolic health, longevity clinicians calculate the Homeostatic Model Assessment of Insulin Resistance (HOMA-IR). Originally developed by Dr. David Matthews at the University of Oxford, HOMA-IR evaluates the mathematical relationship between fasting glucose and fasting insulin:
(Or for SI units: [Fasting Insulin (pmol/L) × Fasting Glucose (mmol/L)] / 22.5)
Interpreting your HOMA-IR score reveals your true metabolic trajectory:
| HOMA-IR Score Range | Clinical Metabolic Classification | Cardiovascular & Cancer Risk Impact |
|---|---|---|
| < 1.0 (Ideal) | Optimal Insulin Sensitivity | Lowest risk of metabolic disease, dementia, and plaque |
| 1.0 to 1.9 | Normal / Borderline Sensitivity | Early subclinical insulin resistance beginning |
| 2.0 to 2.9 | Moderate Insulin Resistance | 2x risk of cardiovascular events; hepatic fat accumulation |
| > 3.0 | Severe Insulin Resistance / Prediabetes | Pancreatic beta-cell failure imminent; severe vascular damage |
The Metabolic Triad: Triglycerides, HDL, and Waist-to-Height Ratio
If your physician refuses to order a fasting insulin test, you can identify insulin resistance with high diagnostic accuracy using the Metabolic Triad:
- Triglyceride-to-HDL Ratio (> 2.0 in mg/dL): In insulin resistance, hepatic de novo lipogenesis accelerates, flooding the bloodstream with triglycerides while HDL particles are cleared rapidly. A TG/HDL ratio above 2.0 (or > 0.87 in mmol/L) correlates strongly with elevated fasting insulin.
- Waist-to-Height Ratio (> 0.50): Measure your waist circumference at the level of the navel and divide by your total height. A ratio greater than 0.50 indicates excess visceral adiposity—the metabolically active abdominal fat that pours inflammatory cytokines directly into the portal vein.
- Elevated Liver Enzymes (ALT > 25 U/L): The liver is the first organ to experience insulin resistance. Mild elevations in Alanine Aminotransferase (ALT) between 25 and 40 U/L often signal early Metabolic Dysfunction-Associated Steatotic Liver Disease (MASLD).
The Clinical Action Plan: How to Drive Fasting Insulin Below 5 uIU/mL
Reversing hyperinsulinemia does not require waiting for prescription pharmaceuticals; it responds rapidly to targeted lifestyle mechanics:
- Eliminate Liquid Sugar and Refined Carbohydrates: Fructose bypasses normal glycolytic feedback loops, metabolizing directly into hepatic triglycerides and ceramides that cause liver insulin resistance within days.
- Zone 2 Cardiovascular Exercise: Accumulate 150 to 180 minutes per week of low-intensity Zone 2 cardio (conversational pace). Zone 2 forces muscle cells to oxidize fatty acids in mitochondrial matrices, clearing out the intracellular diacylglycerols that block insulin signaling.
- Post-Prandial Muscle Contractions: A brisk 10 to 15-minute walk immediately following your largest meal activates non-insulin-dependent GLUT4 translocation, clearing glucose directly into skeletal muscle without requiring a surge of pancreatic insulin.
Continuous Glucose Monitoring (CGM): Glycemic Variability Metrics
While fasting insulin provides a static hormonal snapshot, modern metabolic health optimization leverages Continuous Glucose Monitors (CGMs) to evaluate real-time dynamic glucose excursions. In standard medical care, blood sugar is evaluated only at isolated fasting moments, missing post-prandial glycemic spikes that exceed 140 to 160 mg/dL following carbohydrate consumption.
Repeated post-meal glucose spikes induce acute endothelial dysfunction, generate oxidative reactive oxygen species (ROS), and accelerate the formation of Advanced Glycation End-products (AGEs) that cross-link collagen in arterial walls. By tracking Mean Amplitude of Glycemic Excursions (MAGE) and maintaining post-meal glucose strictly below 120 mg/dL, individuals can directly observe how dietary carbohydrate density and meal sequencing impact their metabolic stability in real time.
Clinical Reversal Timelines: Tracking Biomarker Normalization
When implementing aggressive metabolic interventions—combining dietary carbohydrate restriction, Zone 2 cardiovascular exercise, and intermittent fasting—insulin sensitivity normalizes along a predictable physiological timeline. Hepatic insulin resistance begins to resolve within 72 to 96 hours as ectopic liver fat stores are mobilized for fuel.
Peripheral skeletal muscle insulin sensitivity requires between 6 and 12 weeks of consistent lifestyle modification to fully restore GLUT4 translocation kinetics. By re-testing fasting insulin and calculating HOMA-IR at 90-day intervals, patients and clinicians can track objective biological progress long before conventional HbA1c metrics reflect metabolic healing.
Driving fasting insulin below 5 uIU/mL requires activating metabolic clearing pathways. Learn how botanical compounds compare in our review of Berberine vs Metformin: AMPK Activation & HbA1c Math.
Explore our latest comprehensive breakdown on Urolithin A vs Spermidine: Mitophagy & Autophagy Rules.
Explore our latest comprehensive breakdown on Vitamin D3 and K2 MK-7 Dosing: Arterial Calcification.
Explore our latest comprehensive breakdown on Lipoprotein(a) Blood Testing: Genetic Heart Attack Risk.
Explore our latest comprehensive breakdown on Taurine Longevity Protocols: 3g to 6g Cellular Anti-Aging.
Explore our latest comprehensive breakdown on L-Theanine with Caffeine: Alpha Brainwave Nootropic Math.